Home/Curriculum resources/Geometry of water sources and landforms/Activity 1 - Calculate the area and volume for typical water body shapes
Learning Area:
Mathematics
Year level:
Level 10

Activity 1 - Calculate the area and volume for typical water body shapes
This activity is a part of the Geometry of water sources and landforms resource.
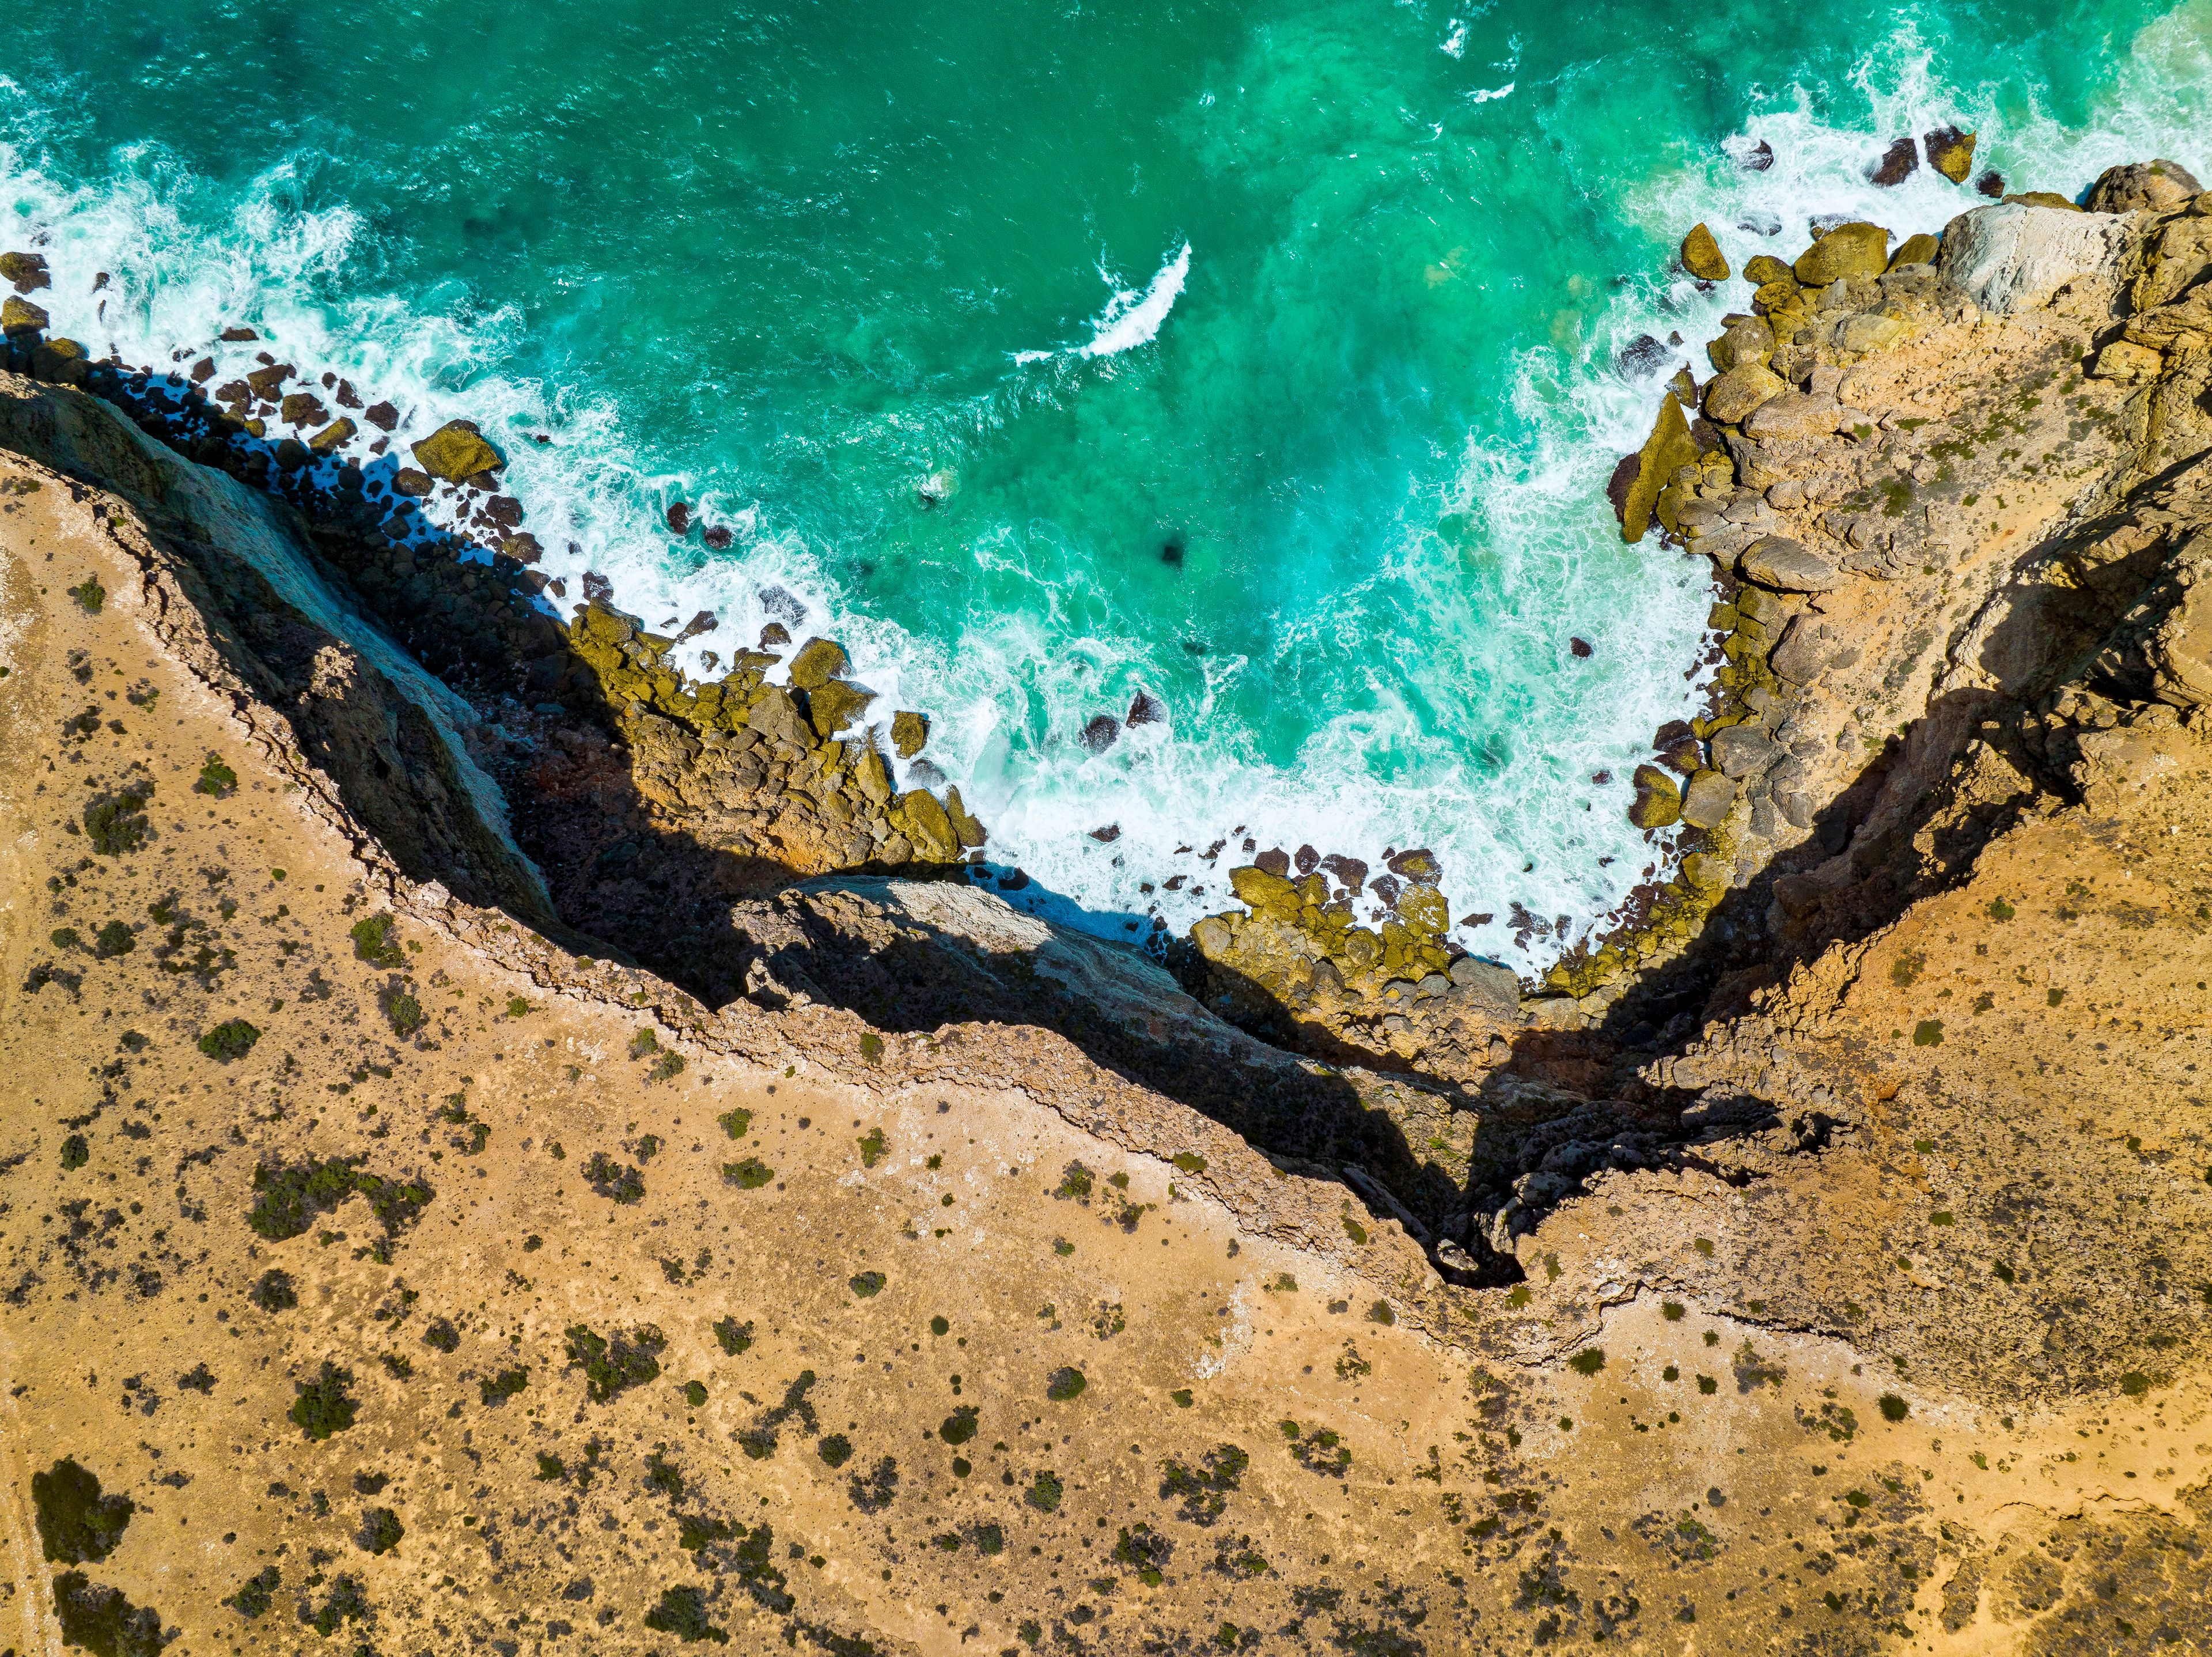
Great Australian Bight, Nullabor, South Australia. Photographer: Robbie Goodall. Source: Getty Images. Used under licence.
Students will calculate the area and volume for different water body shapes, including small rock holes, semi-permanent waterholes, and large permanent waterholes, considering dimensions, slope angles, surface areas, and water sustainability for groups of ten people.
Step by step guide
Step 1: Solve the problem of a small seasonally fragile rock hole, single solid shape
This type of rock hole is usually of limited size and can be especially sensitive to climatic conditions. They can be idealised as a cylindrical shape.

Fig 1: Cylinder representing a small seasonally fragile rock hole
Calculate the total surface area and volume of the waterhole shape assuming the circumference is 7 metres and average depth is 0.5 metres.
Step 2: Solve the problem of a semi-permanent and seasonally variable waterhole, single solid shape
The example of this type of waterhole can be idealised as a triangular prism.
Fig 2a: Sketch of triangular prism. Image source: Nick Watkins (BAppSc), Indigenous Hydrogeologist, WatSec Environmental. Used with permission.
Fig 2b: Photo of water source around and on Arrernte Country. Image source: Michael Watkins. Used with permission.
Calculate the volume of the waterhole assuming the dimensions shown on the idealised shape above.
Calculate the slope angle A of the waterhole bottom.
Calculate the total surface area of the idealised shape above. (Note the length of the sloping base of the water body is equal to the hypotenuse of the end triangle shape).
What would the volume be if the water depth reduced to 2 metres during dry periods? (Note both the depth and the width of the water body will reduce).
Step 3: Solve the problem of a large permanent waterhole, composite solid shape
Assume that this type of waterhole can be idealised by a composite triangular prism / rectangular prism water body.
Fig 3a: Sketch of composite triangular prism/rectangular prism. Image source: Nick Watkins (BAppSc), Indigenous Hydrogeologist, WatSec Environmental. Used with permission.
Fig 3b: Photo of water source around and on Arrernte Country. Image source: Michael Watkins. Used with permission.
Calculate the volume of the waterhole with the dimensions shown on the idealised shape above.
Calculate the slope angle A of the waterhole bottom.
Calculate the total surface of the idealised shape above.
Step 4: Solve the problem involving water volume use
If each person requires 20 litres of water per day, for how long could each of the water bodies sustain a group of ten people? (Note 1 m3 = 1,000 litres). Comment on the likely use of these waterbodies and how this information might be passed on.
Related activities within this resources:

Activity 2 - Calculate angles and distances of ascent and descent
Students will calculate angles and distances of ascent and descent for traversing steep terrain to access waterholes.

Activity 3 - Interesting attribute of a circle
In this final activity students will create three circles with different radii, mark four points around each circle to construct ABC triangles, and use a protractor to measure the angle ABC.

Activity 4 - Possible further activity
In this extension activity, students will utilise State/Federal water resource databases to access time series monitoring data for known water sources, statistically analyse the data to determine mean, minimum, and maximum values, explore relationships between water quality and quantity variables, and draw conclusions about the suitability of these water resources for potable water.